METER / GAUGE SYSTEM
-
OUTLINE
-
A combination meter with a Thin Film Transistor (TFT) type main display and multi-information display is provided.
-
Light Emitting Diodes (LEDs) are used for the indicator lights and warning lights.
-
A Hybrid System Indicator is provided. It indicates the output and regeneration conditions of the hybrid system and has an Eco Acceleration Guidance that shows the guide of Eco-friendly accelerator pedal operation.
-
A warning buzzer is provided in the combination meter to sound when a seat belt is unfastened or when the vehicle is reversing.
-
The meter ECU (meter circuit plate), mounted in the combination meter, receives signals from ECUs and sensors and shows vehicle information.
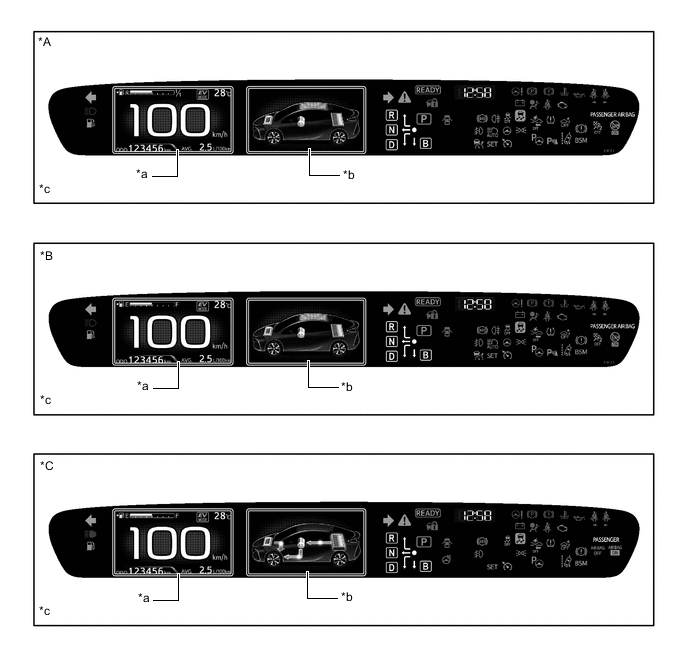
*A Models for Europe (LHD) *B Models for General Countries *C Destination Package for South Korea - - *a Main Display *b Multi-information Display *c The illustrations shown are examples only. - - 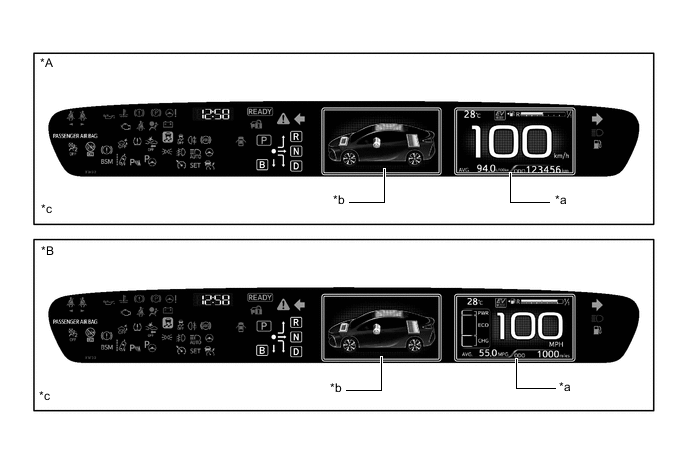
*A Models for Europe (RHD) *B Destination Package for United Kingdom *a Main Display *b Multi-information Display *c The illustrations shown are examples only. - - -
Headup Display
-
A headup display has been adopted to enable the driver to see driving information more easily within their field of view.
-
The combination meter mirror ECU and the structure of the windshield glass enables the headup display to project an image as if it is displayed outside of the windshield glass.
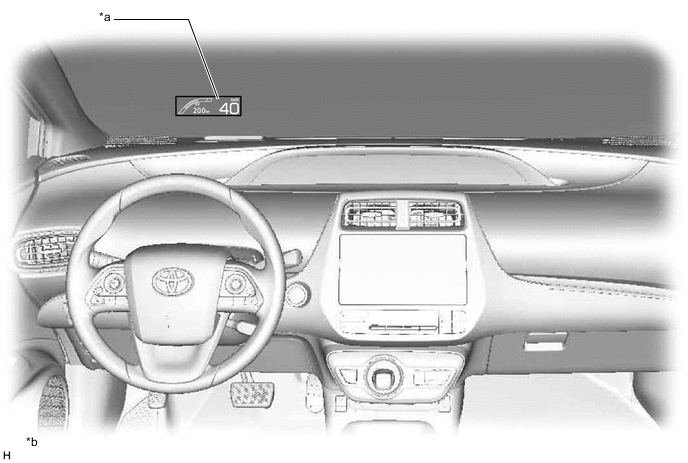
*a Projected Image from the Headup Display *b The illustrations shown are examples only.
-
-
-
MAIN FEATURES
-
Main Display
-
The main display shows the following information:
Item Outline Speedometer Displays the current vehicle speed. Fuel Gauge Displays the fuel remaining amount. Ambient Temperature Displays the ambient temperature.
-
Odo Meter
-
Trip Meter
-
Cruising Range After Hybrid System Start-up
-
Cruising Range
-
Possible Driving Distance in EV Mode
-
Displays the odometer, trip meter A, trip meter B, cruising range after hybrid system start-up, cruising range or possible driving distance in EV mode.
-
Displayed item can be switched by pressing the ODO/TRIP switch.
Indicator
-
When the display conditions are met, the following indicators illuminate.
-
Eco Mode Indicator
-
Power Mode Indicator
-
EV Drive Mode Indicator
-
Hybrid Battery Charge Mode Indicator
-
EV City Mode Indicator*1
-
EV Auto Mode Indicator*2
Light Control Rheostat This item is displayed when the meter panel luminance is adjusted by using the rheostat switch.
-
Road Sign Assist*1
-
Adjustable Speed Limiter
-
This item is displayed when the settings is switched to the road sign assist or adjustable speed limiter
-
The displayed item can be changed by using the steering pad switch.
Tech Tips
The road sign assist or adjustable speed limiter can be turned on or off from the settings tab.
-
Current Fuel Consumption
-
Hybrid System Indicator
-
State Of Charge
-
This item is displayed when the settings is switched to the split mode.
-
The displayed item can be changed by using the steering pad switch.
Tech Tips
Split mode can be turned on or off from the settings tab.*2
*1: Models for Europe
*2: Destination package for South Korea
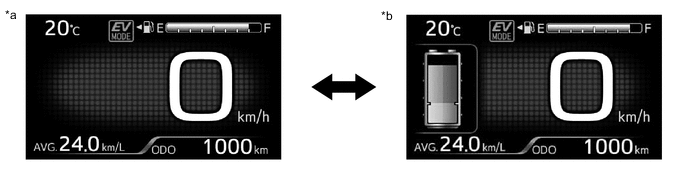
*a Simple Mode *b Split Mode -
-
-
Multi-information Display
-
The multi-information display shows the following information.
Item Outline Information
-
The following information can be displayed on the multi-information display by switching between tabs.
-
Drive Information
-
Navigation Information*1
-
Audio Information
-
Air Conditioning System Information
-
Dynamic Radar Cruise Control System/Lane Departure Alert System Inform/Road Sign Assist
-
Message
-
Settings
-
The tab can be switched using the RIGHT/LEFT switch of the steering pad switch assembly.
Simple Intelligent Parking Assist System*2 This item is displayed when the simple intelligent parking assist system is operating. *1: Models with navigation system
*2: Models with simple intelligent parking assist system
-
-
The drive information shows the following information.
Item Outline Drive Information
-
The following items can be displayed.
-
Energy Monitor
-
Hybrid System Indicator/State Of Charge/Eco Score/Possible Driving Distance in EV Mode
-
Consumption Record
-
Drive Monitor 1
-
Drive Monitor 2
-
Eco Diary
-
The item shown can be changed using the UP/DOWN switch of the steering pad switch assembly.
-
-
The eco score display is added to the hybrid system indicator and air conditioning system information display. The eco score displays a score of how the vehicle and air conditioner is being operated, in order to support eco driving.
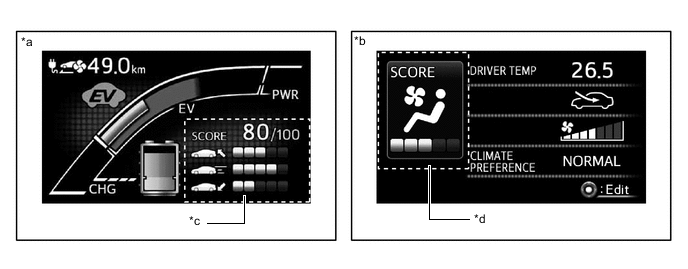
*a Hybrid System Indicator Display *b Air Conditioning System Display *c Eco Score Display (Driving Conditions Score) *d Eco Score Display (Air Conditioning System Score) Tech Tips
When the power switch is turned off, an eco score result and comment is displayed.
-
-
Hybrid System Indicator
-
The Hybrid System Indicator displays the total of the HV battery and engine output as the hybrid system output.
-
The scale of the bar graph on the Hybrid System Indicator display changes with EV mode or HV mode.
-
The eco acceleration guidance is added to the hybrid system indicator. The eco acceleration guidance displays a bar shape to indicate the guide of accelerator pedal operation.
-
The scale for the Hybrid System Indicator (EV mode) is divided into 3 areas (Charge, EV drive, Power). The role of each area is as follows.
Figure 1. Hybrid System Indicator (EV Mode)
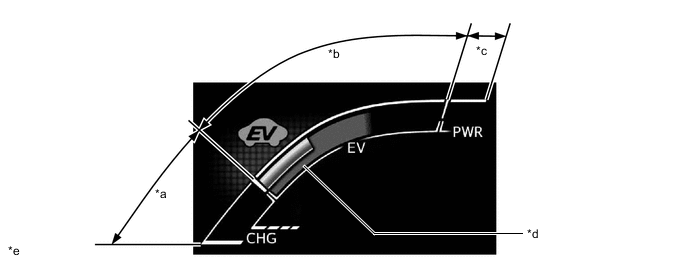
*a Charge Area *b EV Drive Area *c Power Area *d Eco Acceleration Guidance *e The illustrations shown are examples only. - - Information Displayed in Hybrid System Indicator (EV Mode) Area Function Charge
-
The Charge area informs the driver of a state in which energy is being regenerated.
-
The EV drive mode indicator turns on.
EV Drive
-
The EV drive area informs the driver of an EV driving state in which only the motor is running with the engine stopped.
-
The EV drive mode indicator turns on.
Power
-
The power area informs the driver of a driving state in which the engine is started up.
-
The EV drive mode indicator turns on.
-
-
The scale for the Hybrid System Indicator is divided into 3 areas (Charge, Eco, Power). The role of each area is as follows.
Figure 2. Hybrid System Indicator (HV Mode)
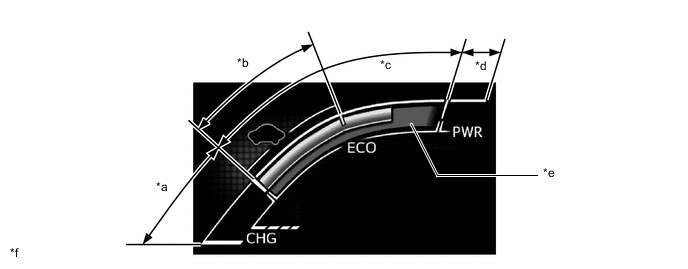
*a Charge Area *b Hybrid Eco Area *c Eco Area *d Power Area *e Eco Acceleration Guidance *f The illustrations shown are examples only. Information Displayed in Hybrid System Indicator (HV Mode) Area Function Charge The Charge area informs the driver of a state in which energy is being regenerated. Eco
-
The Eco area informs the driver when the vehicle is being driven in an Eco-friendly manner.
-
The Hybrid Eco area informs the driver of a fuel-efficient hybrid driving state, in which vehicle uses less power and the engine is more likely to stop operating.
Power The Power area informs the driver of a driving state in which power rather than environmental consideration is required. -
-
-
EV Driving Information
-
The percentage of the remaining energy for which EV mode driving is possible and the possible driving distance in EV mode are displayed on the multi-information display.
-
The percentage of the remaining energy for which EV mode driving is indicated between 0 % (when the energy available for EV mode driving is fully used up) and 100 % (when the HV battery is fully charged).
-
The possible driving distance in EV mode is calculated based on the SOC of the HV battery and the actual driven distance. Also, when the air conditioning system is operating, the possible driving distance changes to a display which reflects the air conditioning energy consumption.
-
The EV driving information can be changed using the setting tab.
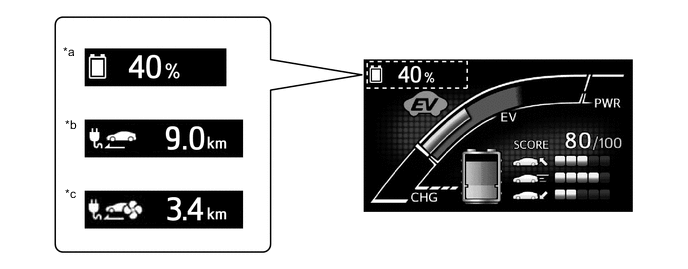
*a Percentage of the Remaining Energy for Which EV Mode Driving *b Possible Driving Distance in EV Mode *c Possible Driving Distance in EV Mode (when using air conditioning) - -
-
-
Power Consumption and Air Conditioning System Load Ratio Information
-
Power consumption history and air conditioning system load ratio history have been added to the Eco diary of the drive information tab. Either a daily display which displays 31 days of data or a monthly display which displays 24 months of data can be displayed.
-
The possible driving distance in EV mode and energy for which EV mode driving is possible (when using air conditioning) have been added to Drive Monitor 2 of the drive information tab. By arranging the 2 screens, the possible driving distances in EV mode when the air conditioning system is on and off can be compared.
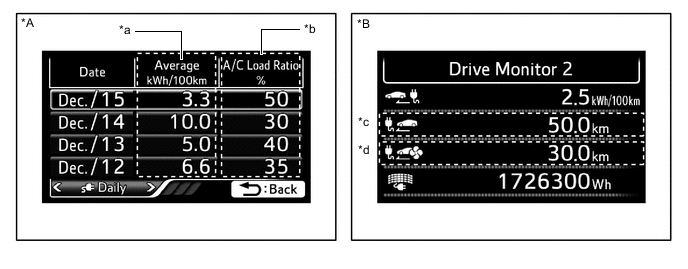
*A Eco Diary *B Drive Monitor 2 *a Power Consumption History *b Air Conditioning System Load Ratio History *c Possible Driving Distance in EV Mode *d Possible Driving Distance in EV Mode (when using air conditioning)
-
-
Plug-in Charging Settings
-
The plug-in charging settings screen is displayed on the multi-information display.
-
The plug-in charge settings can be used to set the change schedule, charging connector lock, charge current, and traction battery heater settings.
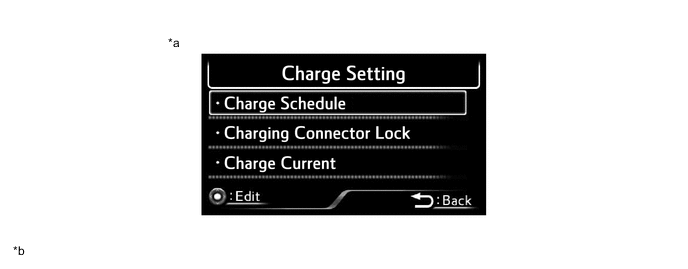
*a Plug-in Charging Setting Screen *b The illustrations shown are examples only.
-
-
Headup Display
-
The headup display shows the following information:
Figure 3. LHD Models
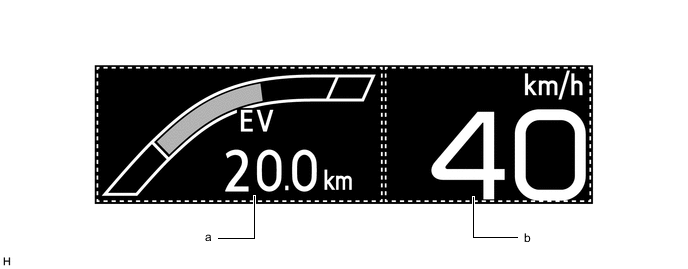
The illustrations shown are examples only.
Figure 4. RHD Models
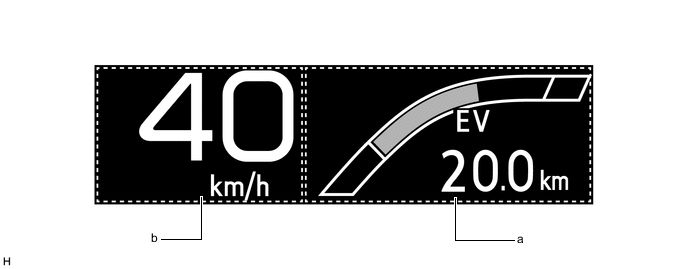
The illustrations shown are examples only.
Area Displayed Item a
-
Pre-crash Safety System Display*1
-
Dynamic Radar Cruise Control System Notification Display*2
-
Intelligent Clearance Sonar System Display*3
-
Lane Departure Alert System Display*4
-
Unsteady Driving Alert Display*4
-
Hands off Steering wheel Alert Display*4
-
Navigation System Display*5
-
Hybrid System Indicator
-
State Of Charge
-
Possible Driving Distance in EV Mode
-
Road Sign Assist*6
b Speedometer *1: Models with pre-crash safety system
*2: Models with dynamic radar cruise control system
*3: Models with intelligent clearance sonar system
*4: Models with lane departure alert system
*5: Except models for Europe
*6: Models with road sign assist
-
-
-