METER / GAUGE SYSTEM
-
FUNCTION
-
Multi-information Display
-
The multi-information display is located on the passenger side.
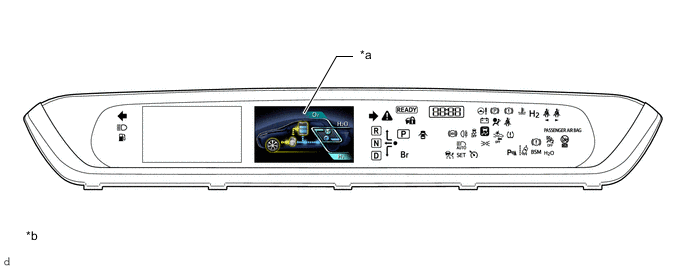
*a Multi-information Display *b The illustrations shown are examples only.
-
-
Opening
-
At READY ON, the multi-information display and the main display are linked, and the opening ceremony is displayed.
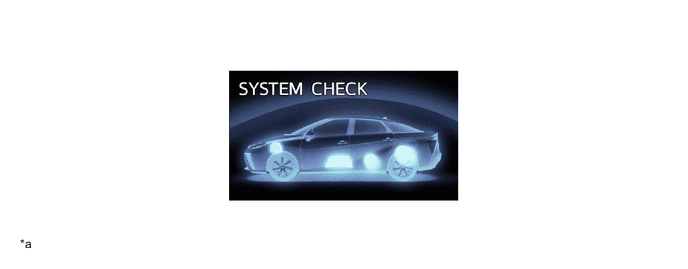
*a The illustrations shown are examples only. - -
-
-
Waiting for FC System
-
After the opening ceremony is complete, this screen is shown if more time is necessary before the FC system can be started.

*a The illustrations shown are examples only. - -
-
-
Switching Tab
-
By switching between 6 different types of tabs, each content screen on the drive information tab, navigation information tab, audio information tab, driving assist systems tab, warning messages tab and settings tab can be displayed.
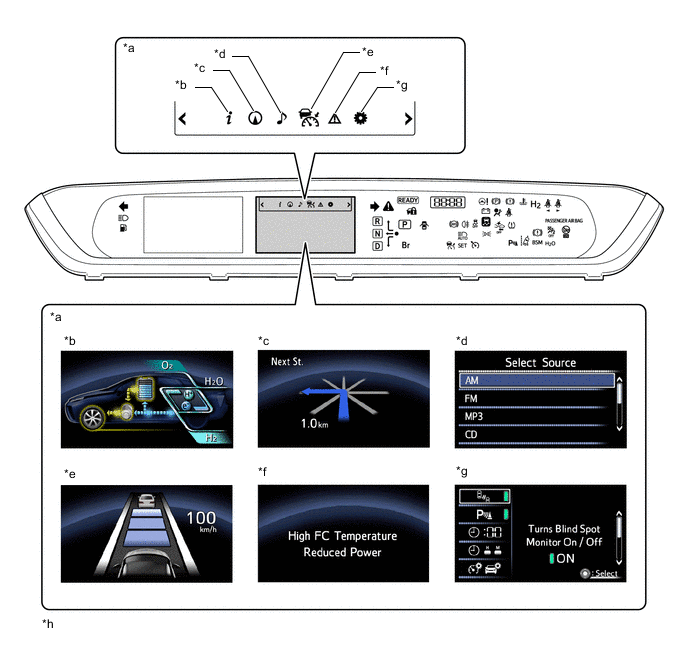
*a Multi-information Display *b Drive Information Tab *c Navigation Information Tab *d Audio Information Tab *e Driving Assist Systems Tab *f Warning Message Tab *g Settings Tab *h The illustrations shown are examples only.
-
-
Drive Information Tab
-
In the drive information tab, the following 6 types of content screens are available: energy monitor, FC system indicator and Eco judge, fuel consumption history, drive monitor, Eco diary and power meter.
-
Energy Monitor
-
The energy monitor uses graphics for the FC stack assembly, motor, traction battery (EV battery assembly) and tire to show the energy transmission direction under FC system control and the traction battery (EV battery assembly) SOC (state of charge) condition in real-time.
-
The energy transmission directions are indicated by arrows and illuminated lines.
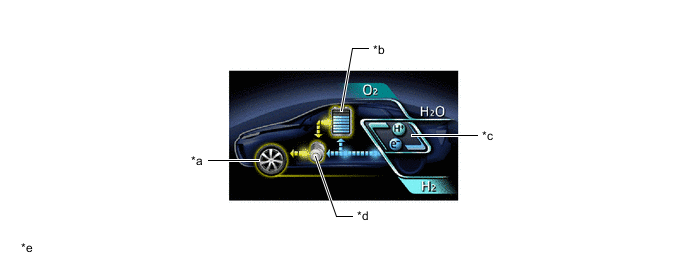
*a Tire *b Traction Battery (EV Battery Assembly) *c FC Stack Assembly *d Motor *e The illustrations shown are examples only. - - Energy Monitor Display Function Arrow Direction Arrow Display Color Display Function FC Stack Assembly→Motor Blue Electricity generated in the FC stack assembly is being transmitted to the motor. FC Stack Assembly→Traction Battery (EV Battery Assembly) Blue Electricity generated in the FC stack assembly is being transmitted to the traction battery (EV battery assembly). Traction Battery (EV Battery Assembly)→Motor Yellow Electricity in the traction battery (EV battery assembly). is being transmitted to the motor. Motor→Traction Battery (EV Battery Assembly) Yellow Electricity generated in the motor is being transmitted to the traction battery (EV battery assembly). Motor→Tire Yellow Drive power is being transmitted from the motor to the tire. Tire→Motor Yellow Regenerated energy from deceleration or braking is being transmitted from the tire to the motor. Traction Battery (EV Battery Assembly) Charge Status Item Display Function Traction Battery (EV Battery Assembly) During IG ON, the state of charge of the traction battery (EV Battery Assembly) is displayed with an 8 segment bar graph.
-
-
FC System Indicator and Eco Judge
-
2 types of information, the FC system indicator and the Eco judge, are displayed on the same screen.
-
The FC system indicator displays accelerator pedal operation and regeneration status as bar graphs.
-
The Eco judge separates the driving scenes into the 3 patterns of Eco-Start, Eco-Cruise and Eco-Stop, and displays its judgment as to whether driving in each type of scene is being done in an environmentally friendly way as 5 stage bar graphs. Also, those driving conditions are displayed as a combined numerical Eco score.
-
When the vehicle is stopped and the shift position is changed to P, the display changes to the Eco judge only.
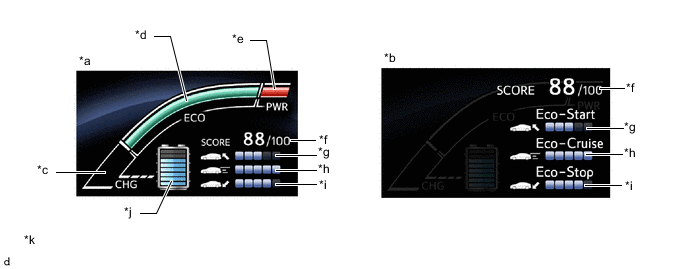
*a Driving *b Stopped with the Shift Position in P *c Charge Area *d Eco Area *e Power Area *f Eco Score *g Eco-Start *h Eco-Cruise *i Eco-Stop *j Remaining SOC *k The illustrations shown are examples only. - - FC System Indicator Item Display Function Power Area When the bar is in this area, driving is in excess of the environmentally friendly range (high output, etc.). Eco Area When the bar is in this area, the vehicle is being driven in an environmentally friendly way. Charge Area When the bar is in this area, energy is being regenerated. Remaining SOC During power switch on (IG), the state of charge of the traction battery (EV Battery Assembly) is displayed with an 8 segment bar graph. Eco Judge Item Display Function Eco Score For each driving trip from the time the vehicle is stopped to the next time it is stopped, the driving conditions of Eco starts, stable driving, and Eco stops are calculated and combined into a numerical evaluation, with 100 points being a perfect score. Eco-Start The driving conditions during acceleration from a vehicle stop to a stable driving speed are displayed as a 5 stage bar graph. Eco-Cruise The driving conditions when driving at a stable driving speed are displayed as a 5 stage bar graph. Eco-Stop The driving conditions during deceleration from a stable driving speed to a vehicle stop are displayed as a 5 stage bar graph.
-
-
Fuel Consumption History
-
The fuel consumption history displays the 1-minute, 5-minute and 1-month average fuel consumption histories as bar graphs in order to observe changes in fuel consumption.
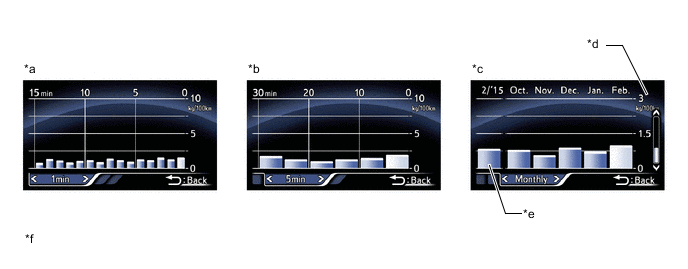
*a 1-minute Average Fuel Consumption History *b 5-minute Average Fuel Consumption History *c 1-month Average Fuel Consumption History *d Scale *e Average fuel Consumption from the same month, 1 year ago. *f The illustrations shown are examples only. Fuel Consumption History Item Display Function 1-minute Average Fuel Consumption History The 1-minute average fuel consumption for the last 15 minutes is displayed as a series of bar graphs. 5-minute Average Fuel Consumption History The 5-minute average fuel consumption for the last 30 minutes is displayed as a series of bar graphs. 1-month Average Fuel Consumption History
-
The 1-month average fuel consumption for the last 4 months and from the same month 1 year ago is displayed as a series of bar graphs.
-
The horizontal axis scale can be switched between 3 types.
-
From the "Customize" screen in the settings tab, the 1-month average fuel consumption history can be cleared.
-
-
-
Drive Monitor
-
The drive monitor is linked to the odometer/trip meter, and displays driving time, average vehicle speed, and average fuel consumption
-
The odometer/trip meter shows the odometer display and the driving distance after starting display, and when blank (not displayed), shows the driving time, average vehicle speed and average fuel consumption since power switch on (IG).
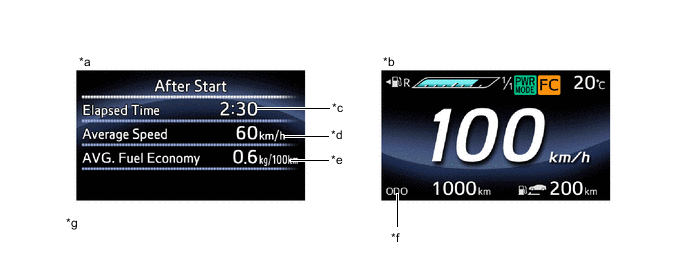
*a Multi-information Display *b Main Display *c Driving Time *d Average Vehicle Speed *e Average Fuel Consumption *f Odometer/Trip Meter *g The illustrations shown are examples only. - - Driving Monitor Item Display Function Driving Time
-
During the odometer display, the driving distance after starting display, and when blank (not displayed), the internal clock is used to calculate and display the driving time since power switch on (IG).
-
During trip meter A and trip meter B display, the internal clock is used to calculate and display the calculate and display the driving time since each trip meter was reset.
Average Vehicle Speed
-
During the odometer display, the driving distance after starting display, and when blank (not displayed), the driving distance since power switch on (IG) (based on vehicle speed signal) and driving time are used to calculate and display the average vehicle speed.
-
During trip meter A and trip meter B display, the driving distance since each trip meter was reset (based on vehicle speed signal) and the driving time are used to calculate and display the average vehicle speed.
Average Fuel Consumption
-
During the odometer display, the driving distance after starting display, and when blank (not displayed), the driving distance since power switch on (IG) (based on vehicle speed signal) and fuel usage amount (based on hydrogen consumption amount) data are used to calculate and display the average fuel consumption.
-
During trip meter A and trip meter B display, the driving distance since each trip meter was reset (based on vehicle speed signal) and fuel usage amount (based on hydrogen consumption amount) data are used to calculate and display the average fuel consumption.
-
-
-
Eco Diary
-
Eco diary displays a list of the daily and monthly driving distance and average fuel consumption history.
-
From the "Customize" screen in the settings tab, the daily Eco diary and monthly Eco diary history data can each be cleared.
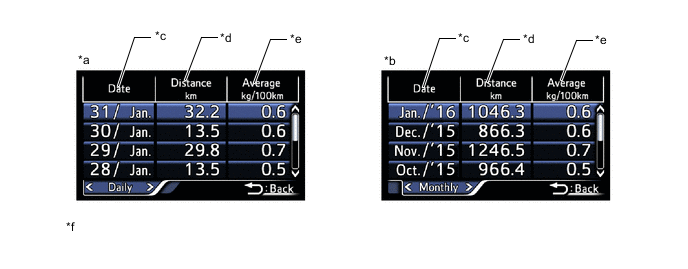
*a Daily Eco Diary *b Monthly Eco Diary *c Date *d Driving Distance *e Average Fuel Consumption *f The illustrations shown are examples only.
-
-
Power Meter
The power meter displays the output status of the FC system as a bar graph.
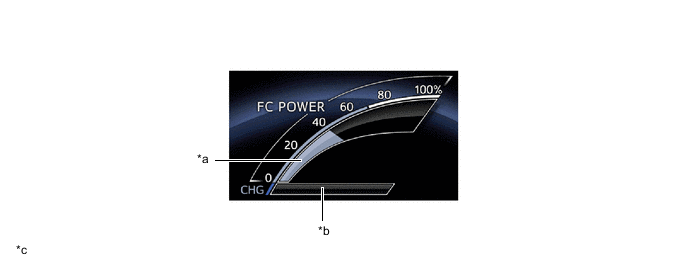
*a Power Area *b Charge Area *c The illustrations shown are examples only. - - Power Meter Item Display Function Power Area Displays the output status of the FC stack assembly and traction battery (EV battery assembly) Charge Area Displays the regeneration status from deceleration and braking.
-
-
Navigation Information Tab
-
The Navigation Information tab displays an electronic compass.
-
During route guidance, the navigation system can display turn-by-turn guidance, an electronic compass, and lane display.
-
During route guidance by the navigation system, at the timing that enlarged intersection view is displayed, turn-by-turn guidance interrupt display is shown on the multi-information screen.
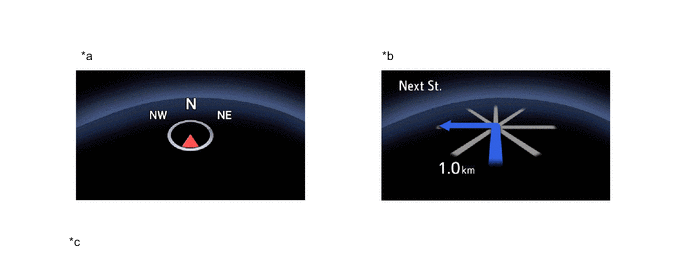
*a Compass *b Turn by Turn *c The illustrations shown are examples only. - -
-
-
Audio Information Tab
-
In the Audio Information tab, audio information (status information) is displayed. Also, audio source switching and song selection can be performed.
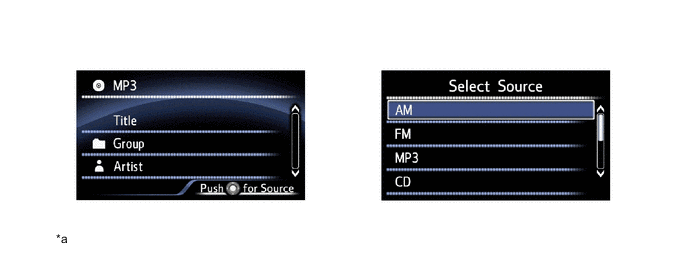
*a The illustrations shown are examples only. - -
-
-
Driving Assist System Tab
-
The driving assist systems tab displays the control conditions of the dynamic radar cruise control system and lane departure alert system. For details, refer to each system.
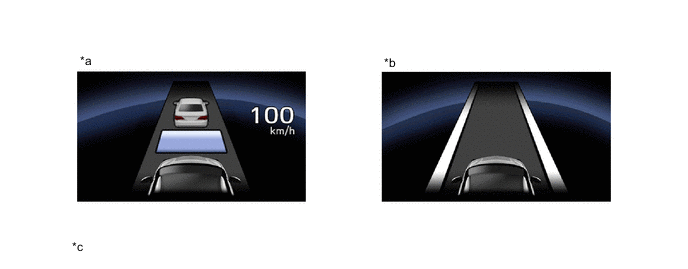
*a Dynamic Radar Cruise Control System *b Lane Departure Alert System *c The illustrations shown are examples only. - -
-
-
Warning Message Tab
-
The warning messages displayed when a malfunction occurs are stored in the warning message tab when the back switch of the steering pad switch assembly is operated.
-
When the system is returned to a normal condition, the warning messages are cleared.
-
When no warning messages are stored, "No Message" is displayed.

*a The illustrations shown are examples only. - -
-
-
Setting Tab
-
The configurable settings are TOYOTA parking assist-sensor system ON/OFF, blind spot monitor system ON/OFF, unit switching*, clock time setting and Customize screen display.
*: For RHD models
-
In the Customize screen, each setting for the meter system can be changed.
Figure 1. (LHD Model)
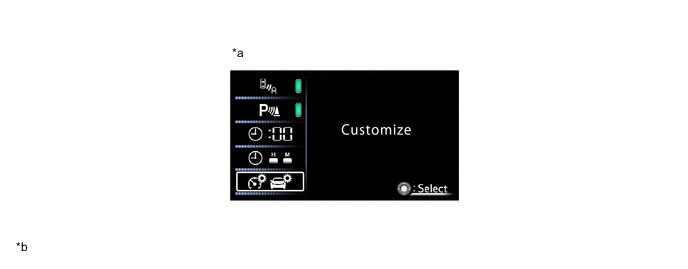
*a Customize / Hierarchy Level 1 *b The illustrations shown are examplesonly. Figure 2. (RHD Model)
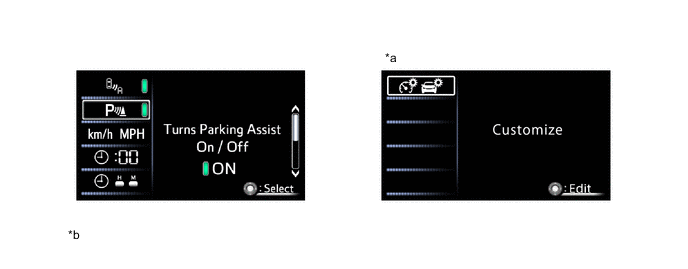
*a Customize / Hierarchy Level 1 *b The illustrations shown are examples only. Meter Customize Setting List Hierarchy Level 2 Hierarchy Level 3 Function Language - The language used on the multi-information display can be selected. Maintenance System Ion Filter Resets the ion filter replacement period. Tire Pressure Initialization Initialization of the tire pressure warning system is performed. Pop-up Display On / Off Route Guidance Interrupt display during route guidance by the navigation system can be turned on/off. Instrument Panel Light Changes between rheostat interrupt display / no display when operating the light control rheostat. Initialization - Setting are restored to factory shipping condition. Simple / Split screen Switching - Switches main display between simple and split screen. Record Reset Monthly Fuel Consumption Resets the monthly average fuel consumption history in the drive information tab / fuel consumption history. Eco-Diary (Daily) Resets the history in the drive information tab / Eco diary. Eco-Diary (Monthly) Calendar - Sets the date. Screen Off - Screen is set to blank (no display)
-
-
Ending
-
When the system is turned to power switch off, the driving time, driving distance, average fuel consumption, Eco-Start, Eco-Cruise, Eco-Stop, Eco score and Eco advice since the previous power switch on (IG) are displayed.
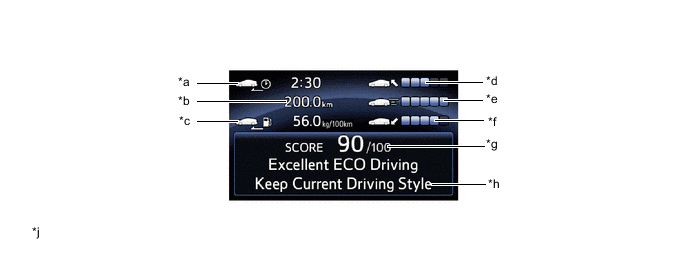
*a Driving Time *b Driving Distance *c Average Fuel Consumption *d Eco-Start *e Eco-Cruise *f Eco-Stop *g Eco Score *h Eco Advice *j The illustrations shown are examples only. - -
-
-