AIR CONDITIONING SYSTEM ON-VEHICLE INSPECTION

-
INSPECT COOLING PERFORMANCE
-
Prepare the vehicle.
Note
-
Clean the cooler condenser assembly if it is dirty.
-
Use the appropriate water/air pressure and tools when cleaning the cooler condenser assembly.
-
Install a manifold gauge set to the vehicle.
-
Ensure the following vehicle conditions for the cooling performance inspection are met.
Vehicle Conditions for Cooling Performance Inspection Item Condition Indicator Vehicle body Parked in shade - Vehicle doors Fully open - A/C switch On 
Engine speed 1500 rpm - Recirculation/fresh switch Recirculation 
Air outlet controller damper operation position FACE 
Temperature setting MAX COLD - Blower speed HI 
Inlet air temperature 25 to 35°C (77 to 95°F) - Refrigerant pressure (High pressure side)*1 1370 to 1570 kPa (14 to 16 kgf/cm2, 199 to 228 psi)
- Air outlets open/closed setting All air outlets fully open - Tech Tips
-
*1: If the high pressure side reading of the manifold gauge set is too high, pour water on the condenser to lower the pressure. If the reading is too low, cover the front of the condenser to increase the pressure.
-
If the condenser pressure is still out of the specified range or unstable even after performing*1, the air conditioning system may be malfunctioning. Perform the refrigerant pressure inspection. Click here
-
-
Set a dry-bulb thermometer and wet-and-dry-bulb thermometer in the locations shown in the illustration.
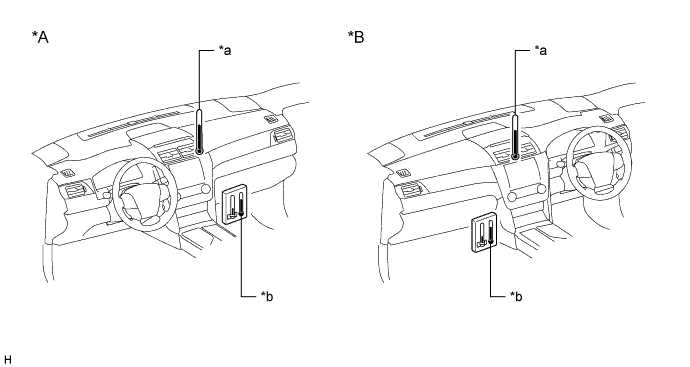
Text in Illustration *A for LHD *B for RHD *a Dry-bulb Thermometer *b Wet-and-dry-bulb Thermometer -
Wait for approximately 5 to 6 minutes with the cooling performance inspection conditions met.
Tech Tips
If the air conditioning system is normal, the outlet air temperature will stabilize in approximately 5 to 6 minutes.
-
-
Measure the inlet and outlet air temperatures
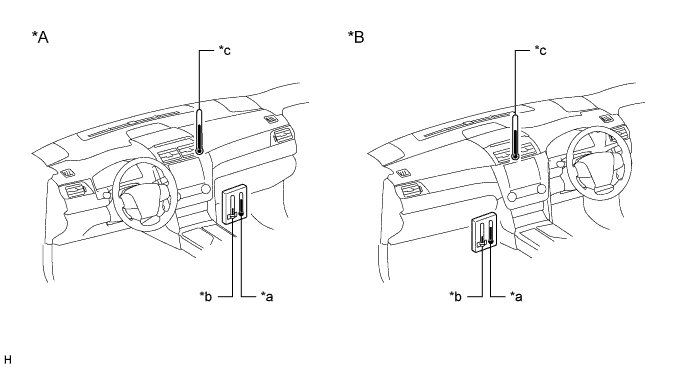
Text in Illustration *A for LHD *B for RHD *a Inlet Air Temperature (Dry-bulb Temperature) *b Inlet Air Temperature (Wet-bulb Temperature) *c Outlet Air Temperature - -
-
Read the inlet air dry-bulb and wet-bulb temperatures.
-
Read the outlet air temperature.
-
-
Calculating the relative humidity
-
Calculate the difference between the inlet air dry-bulb and wet-bulb temperature.
Tech Tips
Temperature difference = Dry-bulb temperature - Wet-bulb temperature
-
According to the following chart, read the relative humidity at the point where the temperature difference and the dry-bulb temperature intersect.
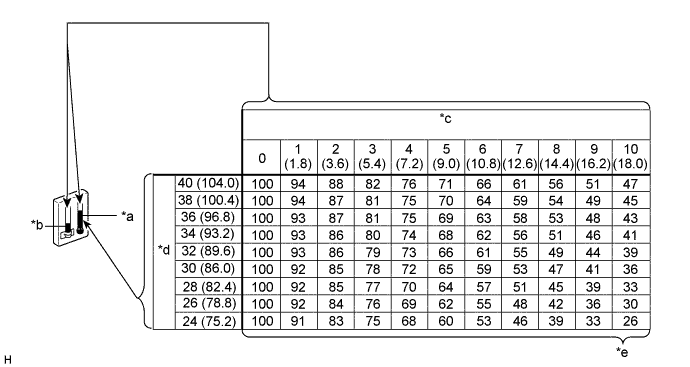
Text in Illustration *a Inlet Air Temperature (Dry-bulb Temperature) *b Inlet Air Temperature (Wet-bulb Temperature) *c Difference between inlet air dry-bulb and wet-bulb temperature (°C (°F)) *d Dry-bulb Temperature (°C (°F)) *e Relative Humidity (%) - - How to read the relative humidity chart:
(Example) When the dry-bulb temperature is 24°C (75.2°F) and the temperature difference is 5°C (9.0°F), the relative humidity is 60%.
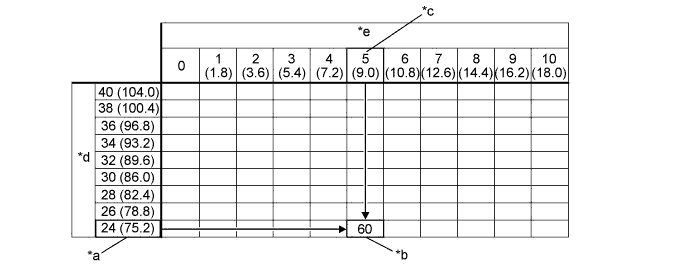
Text in Illustration *a Inlet Air Temperature (Dry-bulb Temperature) (°C (°F)) *b Relative Humidity (%) *c Calculated value (difference between the inlet air dry-bulb and wet-bulb temperature (°C (°F)) *d Dry-bulb Temperature (°C (°F)) *e Difference between inlet air dry-bulb and wet-bulb temperature (°C (°F)) - -
-
-
Inspect cooling performance
-
Calculate the difference between the inlet air dry-bulb temperature and the outlet air temperature.
Tech Tips
Temperature difference = Inlet air dry-bulb temperature - Outlet air temperature
-
According to the following chart, locate the point where the temperature difference and the relative humidity intersect.
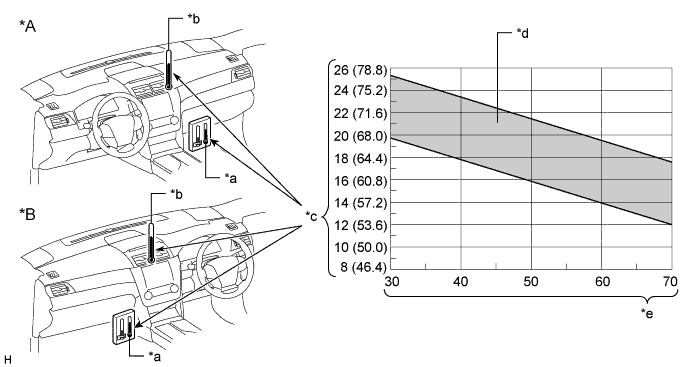
Text in Illustration *A for LHD *B for RHD *a Inlet Air Temperature (Dry-bulb Temperature) *b Outlet Air Temperature *c Difference between inlet air dry-bulb temperature (*a) and outlet air temperature (b*) (°C (°F)) *d Normal Range *e Relative Humidity (%) - - OK The point of intersection is within the normal range shown in the illustration. Tech Tips
When the result is as specified, the inspection is complete as the cooling performance is normal. If the result is not as specified, perform inspections other than the refrigerant leak inspection.
How to read the normal range chart:
(Example) When the difference between the inlet air dry-bulb temperature and outlet air temperature is 18°C (64.4°F) and the relative humidity is 60%, the point of intersection is within the normal range.
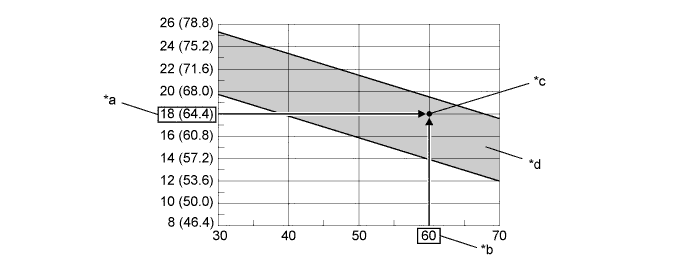
Text in Illustration *a Difference between inlet air dry-bulb temperature and outlet air temperature (°C (°F)) *b Relative Humidity (%) *c Point of Intersection *d Normal Range
-
-